Resources
Frequently asked questions and guides to help you get the most out of Monitorial Pulse.
Guides
Getting Started
Install Monitorial Pulse from the Snowflake Marketplace and configure your first monitors.
- 1Navigate to the Snowflake Marketplace and search for 'Monitorial Pulse'
- 2Click Install and accept the terms
- 3Grant the required metadata read privileges
- 4Open the Monitorial Pulse app and add your first notification destination
- 5Enable monitors from any of the five pillars
Configuring Notification Rules
Set up intelligent routing, suppression, and deduplication to eliminate alert fatigue.
- 1Navigate to the Rules section in the Monitorial Pulse app
- 2Create a new rule and define your filter (pillar, severity, or monitor name pattern)
- 3Select one or more destinations for the rule
- 4Optionally configure suppression windows and deduplication settings
- 5Save and test the rule with a manual trigger
Optimising for Your Team
Tailor monitoring to your team's responsibilities and maturity level.
- 1Identify which pillars are most relevant to your team's role
- 2Start with critical/high severity monitors and expand over time
- 3Use the rules engine to route different pillars to different team channels
- 4Review the Observability Maturity Curve to plan your progression
- 5Schedule a quarterly review to enable additional monitors as needs evolve
Frameworks
The Observability Tax →
Two dimensions of cost every Snowflake customer pays — and how to make them efficient.
Maturity Curve ↓
Five stages from blind spots to predictive intelligence. Where are you today?
Pillars & Types →
Five domains of observability, five levels of monitor sophistication. The full coverage map.
Framework
The Observability Maturity Curve
Five stages from blind spots to predictive intelligence. Most teams are stuck at Stage 3 — Monitorial bridges the gap to Stage 4 and beyond.
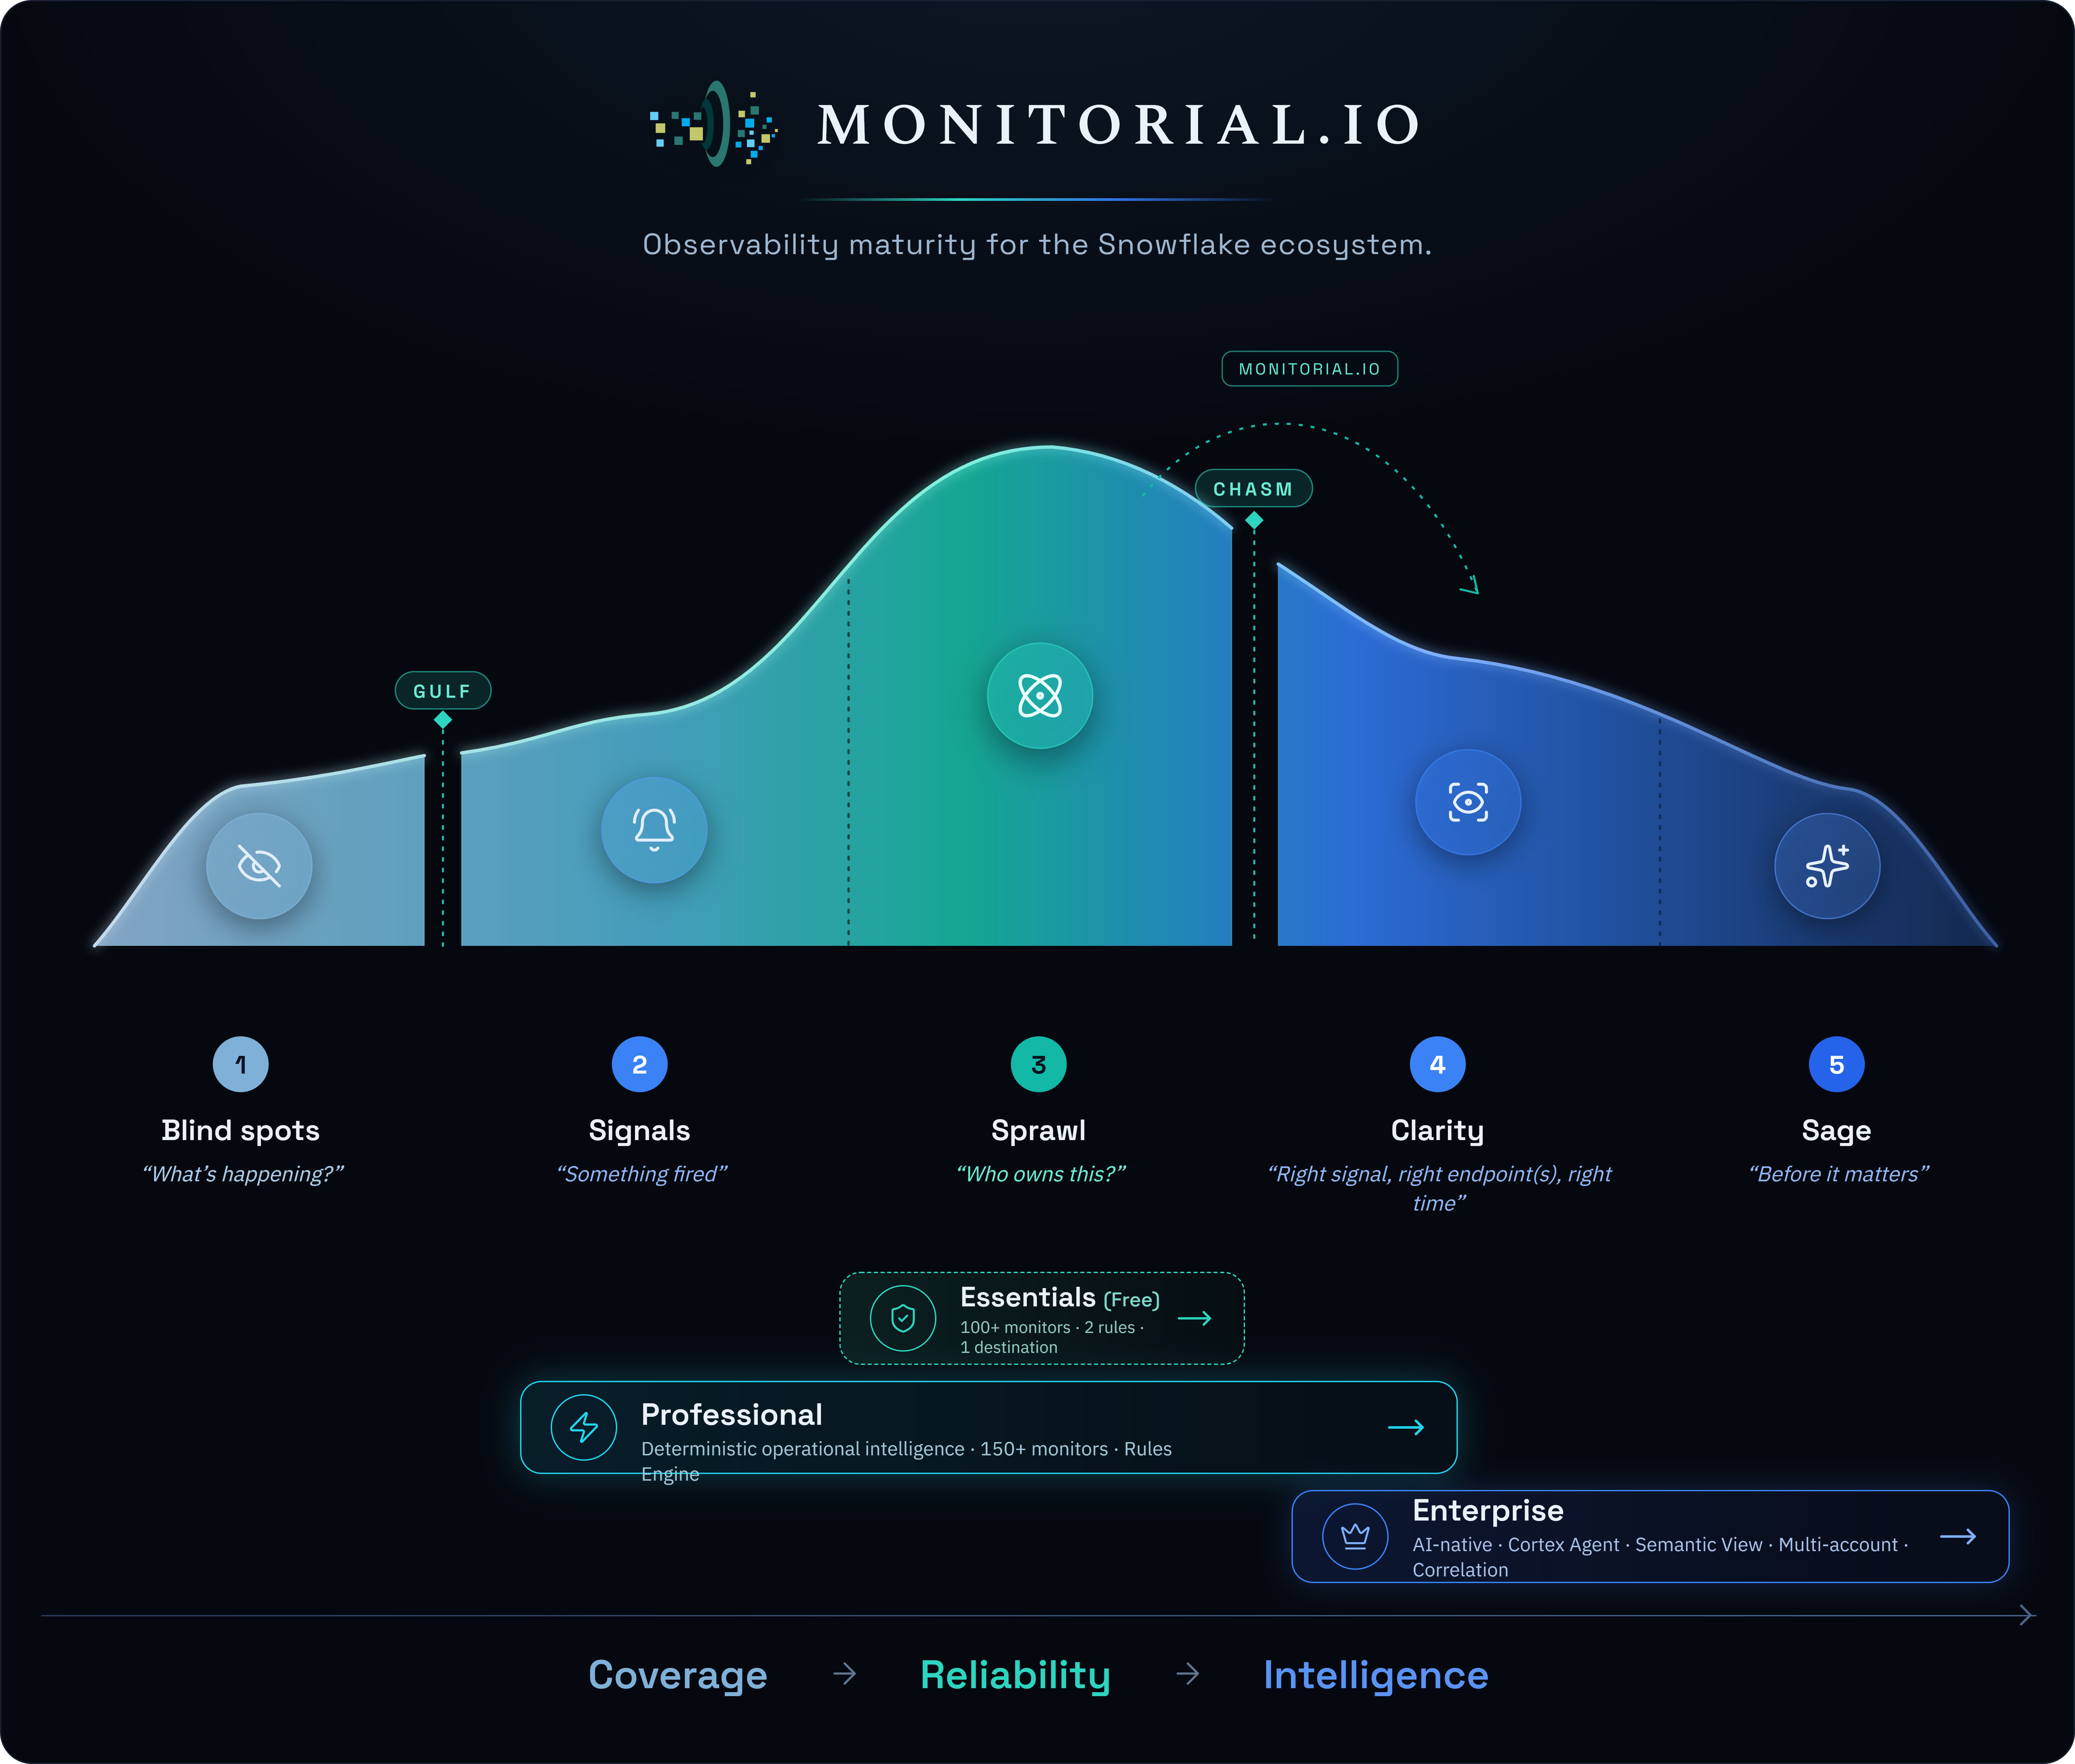
Blind Spots
“What's happening?”Browsing Snowsight manually, checking task history by hand, refreshing dashboards. You don't know what you don't know.
Signals
“Something fired”Trust Center is running, maybe a couple of native Alerts. Coverage is thin, everything channels to a single destination. Someone still has to log in to understand what happened.
Sprawl
“Who owns this?”Mostly good coverage, but no governance or routing. The right team doesn't always get the right alert. Alert rich, signal poor. Human observability tax at peak.
The Chasm — where observability debt accumulates
Stage 3 → 4 is a headcount decision. Process shift + skills gap + precious engineering resources. That's why most teams stay stuck. Monitorial bridges this gap with pre-built monitors, a rules engine, and multi-channel routing — so you don't need to build the infrastructure yourself.
Clarity
“Right team, right time, right endpoint”Rules govern what fires, where it goes, and who owns it. Can go deeper with coverage because orchestration handles the volume. Observability becomes a first-class citizen.
Sage
“Before it matters”Things nobody wrote a monitor for start surfacing — insights for your monthly report, or the answer when you ask 'What are my top 5 priorities today?'
Frequently Asked Questions
What is Monitorial Pulse?
Monitorial Pulse is a Snowflake Native App that provides unified observability and notification capabilities for your Snowflake account. It includes 200+ pre-built monitors across five pillars: FinOps & Performance, Security & Admin, Data Quality, Operational Failures, and Tracing & Logging.
How does the Native App architecture work?
Monitorial Pulse installs directly from the Snowflake Marketplace and runs entirely within your Snowflake account perimeter. It reads Snowflake metadata views using serverless tasks. External connections are opt-in — only formatted alert messages leave your account.
How much does it cost to run?
Monitorial Pulse itself has a free tier (Essentials) with unlimited Tripwire & Threshold monitors. Professional is $2.50/day and Enterprise is $5.00/day. Carefully architected by our engineering team using the best of Snowflake's platform capabilities — designed to keep your observability tax as efficient as possible.
How long does installation take?
You install from the Snowflake Marketplace, grant the required metadata read access, configure your notification destinations, and enable the monitors you need.
What notification destinations are supported?
Slack, Microsoft Teams, PagerDuty, Email (SMTP/SES), Webhooks, Amazon S3, Azure Blob Storage, CloudWatch, and Splunk. The notification rules engine supports multi-destination routing, so a single alert can fire to multiple places simultaneously.
Can I customise which monitors are active?
Yes. All 200+ monitors are available but you choose which to enable. Each monitor is parameterised — you can adjust thresholds, schedules, and scoping without writing any SQL. The Essentials tier includes unlimited Tripwire & Threshold monitors with 3 notification rules and 1 destination.
What is the Notification Rules Engine?
The rules engine gives you fine-grained control over alert routing. Features include wildcard matching (route by monitor name, pillar, or severity), suppression windows for maintenance periods, deduplication to prevent alert fatigue, circuit breakers for runaway monitors, and escalation policies.
Is my data safe?
Absolutely. Because Monitorial Pulse runs as a Native App inside your Snowflake account, your data stays within your perimeter. The app only reads metadata views — it never accesses your actual table data. External connections are opt-in — only formatted notification messages are sent to destinations you explicitly configure and approve.
How do I get support?
Essentials users can access community support via our forums. Professional tier includes priority support. Enterprise tier includes dedicated support with SLA guarantees. You can also reach us via the contact form.