Snowflake Native App
Your Snowflake Health Professional That Never Clocks Off.
Monitors your environment 24/7. Learns what's normal. Detects what isn't — and predicts what's coming. Triages every finding to the right team, at the right severity, through the right channel.
Then answers in plain English. Engineers get root cause. Analysts get SLA impact. Execs get cost impact. Same finding, different lens.
For the price of a coffee a day. Free tier available.
- OAuth: 4 expired tokens (Xero, 36–128 days overdue) breaking integrations.
- Privileged access: ~5,900 queries run under ACCOUNTADMIN by 2 human users over 7 days — violates least-privilege.
- Failed logins: 18 attempts concentrated on one user from 2 IPs — verify stale credential or unauthorized access.
- Cortex agent spend spike: ~840 credits over 28 days (peak 134/day), now your second-largest cost driver with unclear ROI.
- Spend concentration: COMPUTE_WH at 81.8 credits/week is nearly all account spend — worth watching for optimization.
- Pipeline reliability: 99.5% task success across 9,380 runs with zero failures (tasks, Snowpipe, COPY INTO). Solid.
- Stream lag: All CDC streams within SLA. No backlog detected.
- Schema drift: Column CUSTOMER_ID renamed in source — 12 downstream views now returning NULL on that join key.
- Freshness: FACT_ORDERS row count dropped 94% vs yesterday — likely upstream load failure.
- Query regression: TRANSFORM_WH median execution time 3.2x above baseline since Tuesday's deployment.
- Queuing: 38% of queries queued (capacity saturation) — consider scaling or workload isolation.
- Clustering: FACT_EVENTS ratio degraded from 1.2 to 4.7 — full re-cluster recommended.
- Geo anomaly: User ANALYTICS_MIKE queried from Mumbai — first time outside AU/NZ in 6 months.
- Off-hours access: SVC_REPORTING active at 3:47am, 4 hours outside normal window.
- Privilege escalation: 3 GRANT ROLE operations by a non-admin user — investigate immediately.
- Unmasked PII: 3 tables tagged PII accessible by PUBLIC_READER with no masking policy applied.
- CIS benchmark: CIS 2.4 failing — password policy does not meet minimum complexity.
- Orphaned grants: 14 role grants from deprovisioned users still active.
- NULL spike: DIM_CUSTOMER.EMAIL went from 0.3% to 34% NULL in last load — downstream reporting affected.
- Duplicate PKs: 1,247 duplicate primary keys detected in STG_PAYMENTS.
- Schema change: 2 columns added to RAW.HUBSPOT_CONTACTS without downstream propagation.
Continuously monitoring 5 domains…
(highly secure)·Brilliantly simple, simply brilliant·200+ pre-built monitors·Highly performant, cost effective
The Snowflake Observability Maturity Curve
Most teams are stuck at Stage 3. The Chasm between “we have alerts” and “we have observability” is where teams get stuck for years.
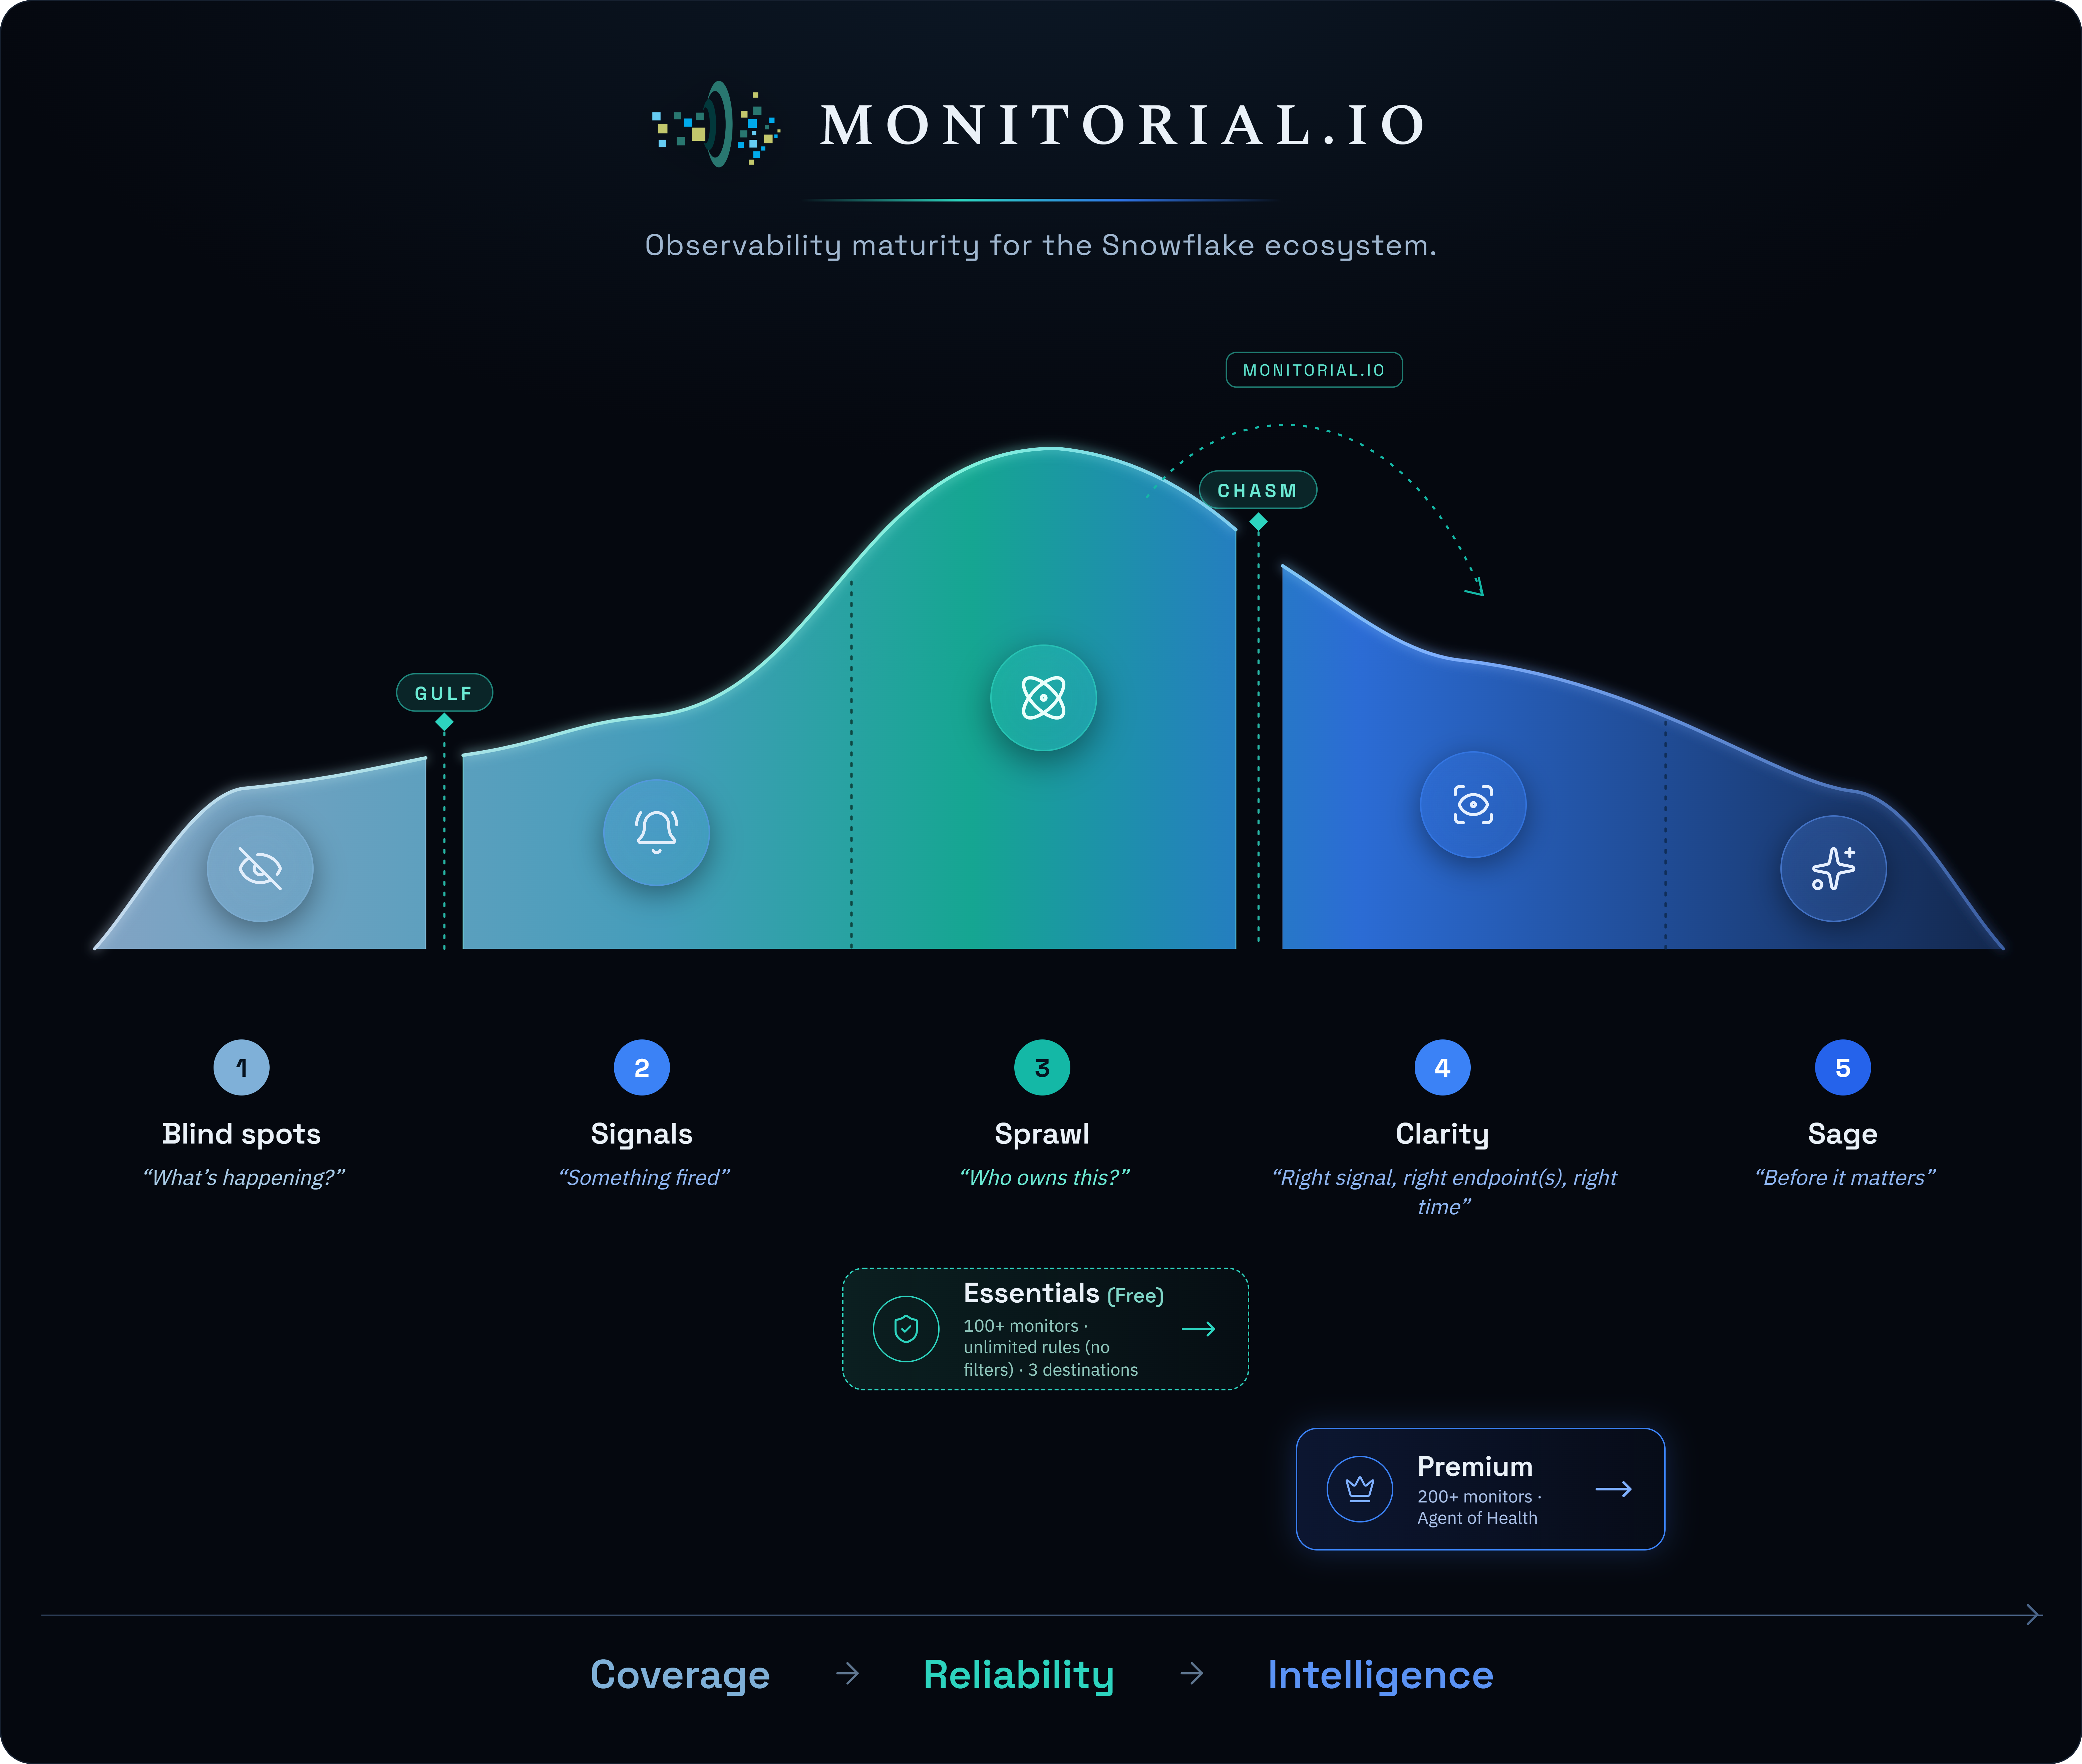
The Chasm isn't about writing more SQL. It's about everything around the SQL: routing, suppression, lifecycle management, formatting, and audit trail. That's an orchestration problem — and that's what Monitorial solves.
One Platform. Five Pillars. Every Team.
200+ monitors spanning every dimension of your Snowflake account. Pre-built. Parameterised. One-click install from the catalogue.
FinOps & Performance
50+Cost anomaly detection, budget breach projection, query attribution, Cortex AI runaway, warehouse efficiency, and anti-pattern detection.
Security & Admin
100+CIS 1.x/2.x/3.x benchmarks, authentication monitoring, privilege escalation, network policies, and threat detection.
Data Quality
33+Stream staleness, pipe health, dynamic table refresh failures, governance coverage gaps, and table validation.
Operational Failures
15+Real-time task and pipe failure alerting via queue integration, replication health, and auto-resolve lifecycle.
Tracing & Logging
36+Handler memory/CPU, SPCS containers, Openflow connectors, Snowflake Postgres, SiS apps, and span performance.
The Notification Rules Engine
Monitors detect problems. But detection without orchestration is just noise.
Most teams hit Stage 3 because they have alerts without rules. Every monitor fires to the same Slack channel. Every severity treated equally. No suppression. No routing logic.
Three rules. Complete coverage.
Rule 1: Prod Critical
database=*PROD*, severity=Critical → PagerDuty + Slack #prod-alerts (15 min suppression)
Rule 2: FinOps
tags=["cost"], severity=Warning → Slack #finops + Teams Leadership (60 min)
Rule 3: Suppress Dev
environment=DEV → (no destinations) = suppressed entirely
A rule with no destinations is a suppression rule. One rule silences your entire dev environment.
Runs Inside Your Snowflake
Monitorial is a Snowflake Native App. It installs from the Snowflake Marketplace and runs entirely within your account perimeter. No data leaves unless you configure a notification destination and approve the connection.
- External connections are opt-in — you control what leaves
- Carefully architected by our engineers using the best of Snowflake
- Quick install from Snowflake Marketplace
- No separate infrastructure to manage
- Runs inside your Snowflake account perimeter
Your Snowflake Account
Monitorial (Native App)
Discover → Analyze → Monitor → Rules Engine
Notification Dispatch
Circuit breakers • Retry • Rate limiting
Alert Destinations (only messages leave)
From Install to First Agent Conversation — Minutes
Install from Snowflake Marketplace. Run the setup wizard. The Agent of Health starts learning your environment immediately. Ask it anything about your Snowflake — cost, security, performance, operations.
Free tier available — unlimited Tripwire & Threshold monitors, 3 destinations. Install from Snowflake Marketplace.